
Understanding and Optimizing the Content SDK Rendering Pipeline
Published: 25 September 2026
Introduction
When building applications with the Sitecore AI Content SDK, performance optimization often starts with the wrong assumptions. A common misconception is that every component on a page makes its own GraphQL request, leading developers to optimize individual components instead of understanding the overall rendering process.
In reality, the Content SDK follows a structured rendering pipeline. A page request flows through the Next.js application, retrieves layout data from Experience Edge, constructs a JSON rendering, and finally renders React components. Knowing where this work happens makes it much easier to identify bottlenecks and optimize performance.
This article explores how the Content SDK rendering pipeline works, where delays can occur, and practical techniques to build faster Sitecore AI applications.
1. Understanding the Rendering Pipeline
Every page request follows a predictable sequence of events.
Instead of rendering components independently, the Content SDK first retrieves the page's layout and component data, then passes the relevant data to each component during rendering.
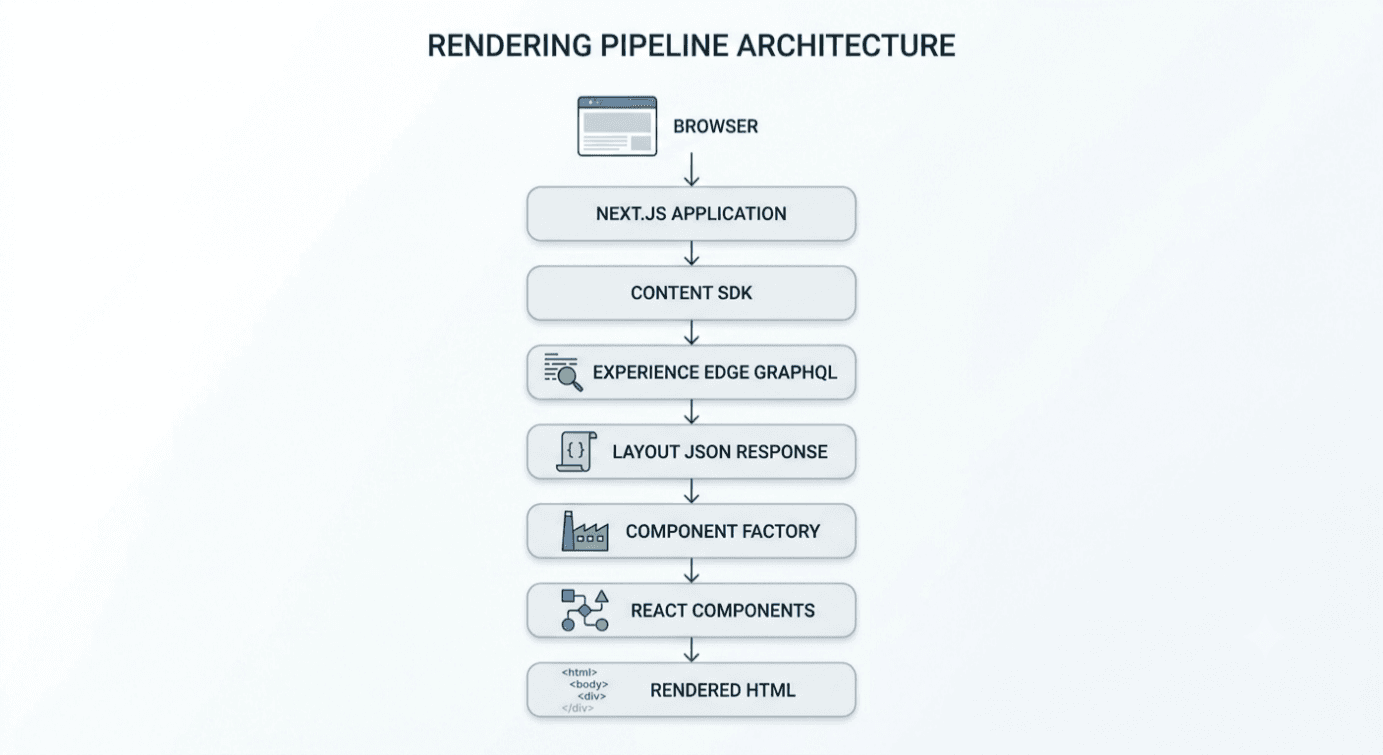
Browser requests the page.
Content SDK requests layout data from Experience Edge.
Experience Edge returns the page's layout data as JSON, which is then used by the Content SDK to render the page.
The Content SDK resolves the rendering to the corresponding React component.
React renders the final HTML.
2. Understanding JSON Rendering
One of the most misunderstood concepts is JSON Rendering.
The Layout API returns a structured JSON document that contains:
- Route information
- Placeholders
- Component hierarchy
- Datasource fields
- Rendering parameters
Each React component receives only its portion of this JSON.
For example:
{
  "componentName": "Hero",
  "fields": {
    "title": {
      "value": "Welcome"
    },
    "description": {
      "value": "Build faster with Sitecore AI"
    }
  }
}
Notice that the Hero component isn't making a separate GraphQL request. It simply consumes the data already available in the Layout response.
This distinction is important because optimizing the Layout response often has a greater impact than optimizing individual components.
3. Where Performance Bottlenecks Occur
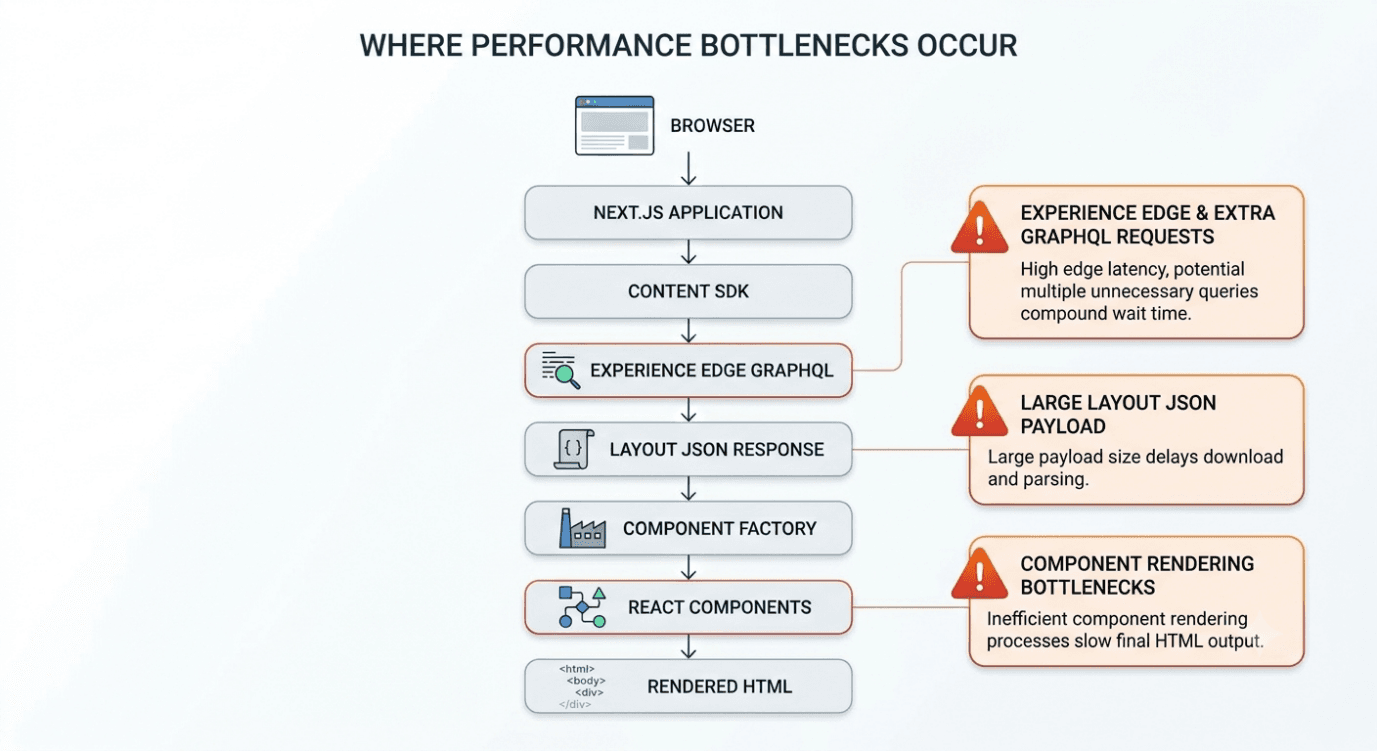
Understanding the rendering pipeline makes it easier to identify where performance issues originate.
Common bottlenecks include:
Large Layout Payloads
The Layout response may include unnecessary fields, deeply nested content, or large Rich Text values that aren't used during rendering.
Additional GraphQL Requests
While the Layout response provides most page data, components may still execute their own GraphQL queries for related content or dynamic data.
Multiple component-level requests can significantly increase total page load time.
Heavy Component Trees
Large pages with numerous nested components require more processing during rendering.
Slow Experience Edge Responses
If the initial Layout query is slow, every component waits for that response before rendering.
4. Optimizing the Rendering Pipeline
Once you understand the flow, optimization becomes much more targeted.
Keep the Layout Response Lean
Only include the fields your components actually render.
Avoid unnecessarily large datasource models or deeply nested field structures.
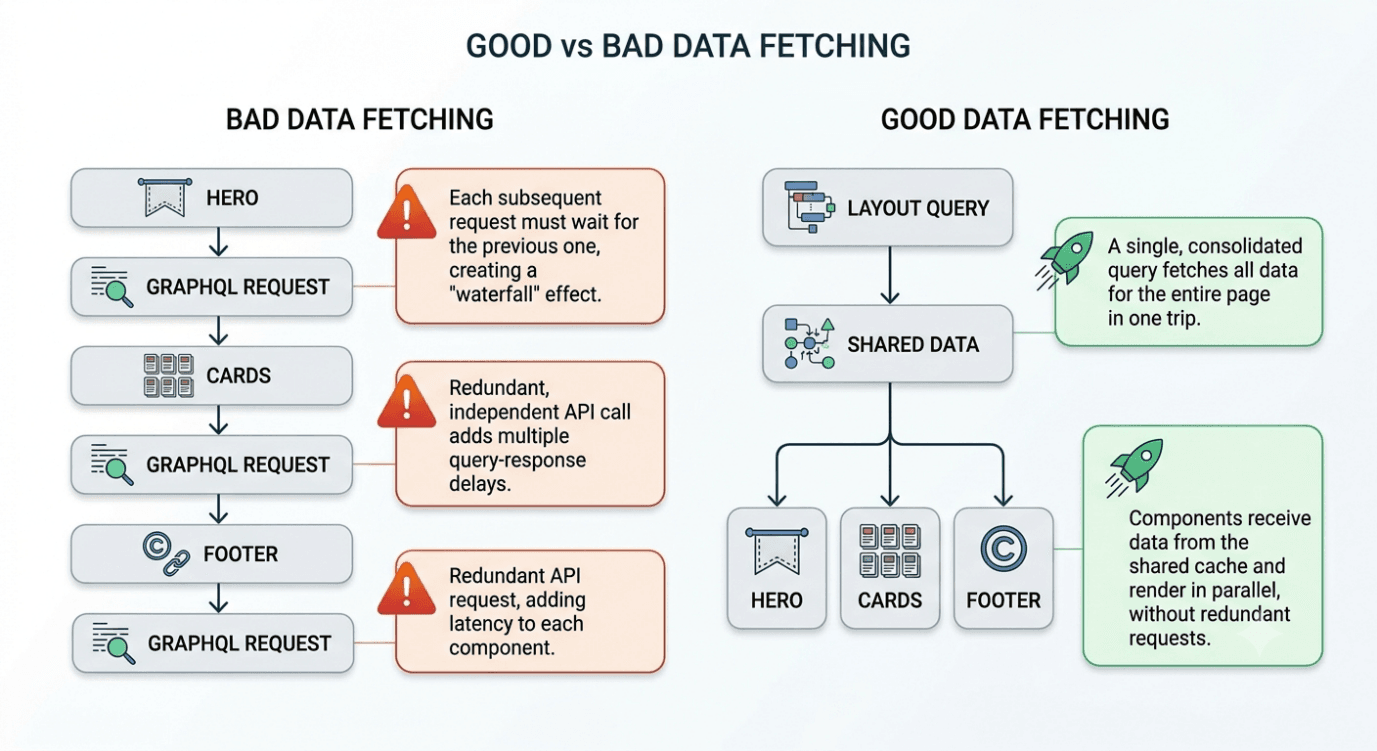
Avoid Duplicate Data Fetching
If several components require the same information, fetch it once and share the data rather than executing identical GraphQL queries multiple times.
Design Lightweight Components
Components should receive only the data they need.
Avoid creating datasource templates containing dozens of unused fields.
Smaller data models result in smaller Layout responses.
Prefer Server-Side Data Fetching
When multiple components depend on the same external data, retrieve it once on the server and distribute it through props rather than performing repeated client-side requests.
5. Debugging Performance Issues
Optimization starts with measurement.
Useful techniques include:
1. Inspect the Layout Response
Review the GraphQL response and verify whether unnecessary fields are included.
2. Measure Payload Size
A fast API response can still transfer hundreds of kilobytes of JSON.
Payload size often matters as much as response time.
3. Identify Additional Requests
Use the browser's Network tab to determine whether components are triggering unexpected GraphQL requests after the Layout response.
4. Compare Timing
- Network latency
- Server processing
- Download time
- Browser rendering
This helps identify the true bottleneck.
6. Best Practices Checklist
Before releasing your application, verify that:
- Layout responses contain only required fields.
- Components avoid unnecessary GraphQL requests.
- Shared data is fetched once and reused.
- Datasource templates remain focused and lightweight.
- Large pages are reviewed for payload size.
- Network requests are monitored during development.
- Experience Edge responses are measured regularly.
Conclusion
The Content SDK rendering pipeline is the foundation of every Sitecore AI application. By understanding how layout data is retrieved, transformed into JSON, and passed to React components, developers can identify performance issues more effectively and make targeted improvements.
Rather than assuming every slowdown is caused by React or individual components, start by examining the rendering pipeline itself. In many cases, reducing the Layout payload, avoiding duplicate GraphQL requests, and designing efficient datasource models can deliver meaningful performance improvements with minimal changes to your application.

Keyur Nayi- Technical lead - ADDACT
Technical lead - ADDACT
Keyur is a Technical Lead at Addact with 9+ years of experience in enterprise CMS and software engineering. He is certified in Sitecore XM Cloud, OrderCloud, Sitecore 10 .NET, and SitecoreAI CMS for Developers (2025), specializing in scalable, cloud-ready and AI-driven implementations.
His technical stack includes ASP.NET/Core, C#, MVC, jQuery, and Azure/AWS, enabling high-performance, cross-platform digital solutions.